Schelling’s Segregation Model, I
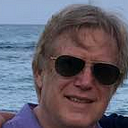
In 1971, the economist Thomas Schelling (Nobel Prize 2005) formulated a simple model to help understand patterns of racial segregation. It can be thought of in terms of a game. There are two kinds of players — A and B, represented by light and dark blue in the case of the image on the left. The players are distributed on a grid, with certain percentage of the squares vacant. The players can be distributed in any way whatsoever, but we have have placed them at random. Below we describe their rules of play and look at some of the patterns that emerge from it.
Caveat: this purely expository article is presented in the spirit of the famous quotation “all models are wrong, but some are are useful,” attributed to George E. P. Box, the noted British statistician.
Note: the simulations of Schelling’s model presented here were carried out using a little app written in Elm, which is a purely functional language. Part II of this article will discuss the design of a simulator in a purely functional language.
Rules of the game
Each player has an emotional state, “satisfied” or “unsatisfied.” That state is determined by whether he feels surrounded by sufficiently many people like himself. To make this notion precise, consider a certain player, X. Unless he is on the edge of the grid or in a corner, he has eight neighbors — two to the North and South, two to the East and West, and also four at the adjacent corners. Player X also has a threshold. This is the minimum number of neighbors like him, A or B, that will make him feel satisfied. Thus X computes his emotional state as a function of just two things: the identity of his immediate neighbors and his threshold.
The state of mind of X is relevant when it comes his turn to play. If he is satisfied, he stays in place. If he is unsatisfied, he moves to a vacant square, chosen at random.
A round of the game is played by first lining up the players in a random order, then having them play in turn. When a player’s turn comes, he checks his neighborhood against his threshold to compute his emotional state and then either moves or stays in place. There is no cooperation among players and there is no central control or policy. Each player acts independently according the rule book. Perhaps surprisingly, these independent “micro” behaviors can produce significant “macro” effects. In the case at hand, the effect is the spontaneous formation of homogeneous neighborhoods — all light blue or all dark blue. The nature of these neighborhoods depends on the player’s thresholds.
Schelling’s model is an early example of what is now called agent-based modeling. It is akin to Conway’s game of life in that both consist of a grid of cells, each with its internal state, each evolving according to set rules. Schelling’s model has sometimes been compared to the 2-dimensional Ising model in physics; there similarities, but the models are in fact rather diferent.
Playing the Game
Schelling ran the model he created using graph paper and coins — dimes and pennies. It took many months to play, though he had sketched out the initial idea on a plane ride writing X’s and O’s with pencil and paper. Nowadays, of course, we use computers, e.g., the web app pictured below. There are many implementations of the game, some given in the references at the end.

The code for the app is available on GitHub.
Experiments
We are going to run four experiments using the Schelling model, each with a different value of the threshold, running from low to high. The goal is to see what kind of macro patterns emerge, if any, from the micro behavior of the agents. At the end we will draw a few conclusions.
In all the experiments, play begins with a predetermined “random” configuration of players, with 10% of the cells unoccupied and a 50–50 split between light and dark blue. All players are put in the “Satisfied” state.

Experiment: threshold 2
We set the threshold to 2, meaning that a player will be satisfied if he has at least two neighbors out of eight who are like him. Below is the result of running the game through 14 rounds of play After the 7th round, there was no change in the configuration. The system had reached a steady state, with a satisfaction level of 100% and not very much change from the initial configuration.

Experiment: threshold 3
We set the threshold to 3, so that a player is satisfied if he has at least three out of eight neighbors who are like him. After 22 rounds of play, the grid looks like the one below. Satisfaction is 100%. This time there is a pronounced grouping into homogeneous neighborhoods.

Experiment: threshold 4
We set the the threshold to 4, so that a player is satisfied if he has at least four neighbors who are like him. After 23 rounds of play, the grid looks like the one below. Large, homogeneous neighborhoods have formed. The satisfaction level is 96.2%. Further play results in small changes, but with the same general characteristics.

Experiment: threshold 5
Let us now set the threshold to 5 This means that a player is satisfied if he has at least five out of eight neighbors who are like him — a majority. After 106 rounds of play, the grid looks like the one below. The population has almost completely separated into two homogeneous regions. The satisfaction level is 94.2%. Further play results in small changes, but with the same general characteristics — and a lot of churn in the border region.

Conclusions
Very modest thresholds expressing the desire to have some neighbors like oneself. At threshold 2 there is very little change from a random configuration, but at threshold 3 there is already a quite marked grouping into homogeneous neighborhoods. At threshold 5, the first case where agents prefer a majority of neighbors like themselves, there is essentially completely segregation.
Models are not reality, but they offer one tool for trying to understand it. Schelling’s model is certainly food for thought. You might enjoy playing around with model at jxxcarlson@github.io.
If there are errors in this article, please let me know.
Appendix
Variants and descendants of the Schelling model have been used in other fields, including biology and generative art. The image below is an example of the latter.

References
- Thomas Schelling (Wikipedi
- Schelling’s original article
- Followup on Schelling’s article (2011)
- Ising, Schelling, and Self-Organizing Segregation (connections with the Ising model in physics)
- A physical analogue of the Schelling model
- Schelling’s Model of Segregation
- The Schelling Model of Residential Dynamics
- Parable of the Polygons
- Seeing Around Corners, Jonathan Rauch, Atlantic Magazine 2002
- Schelling model, generative art, and biology
- Elm-lang.org
- Code on GitHub
- Schelling Model App