Experiments in Generative Art

Quite some time ago (2013), I played around with generative art using Processing. Above is one example, which I retrieved from square-the-circle. In addition to generating an ever-changing image, the code generated music to accompany it. The parameters governing the app could be controlled by some knobs that I rigged up on a little “black box”. I haven’t tried running the code in years, but apparently it still exists, thanks to the miracle of GitHub.
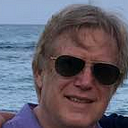
In any case, the generative art bug hit me again, and I decided to revisit the subject, this time using Elm, my tool of choice these days. Here is the result of one experiment:

Part of my inspiration for getting back into this sort of thing was a talk by Xavier Ho, and some of the links I found on his home page, like this one, Organic Grid. Each time you refresh the page for the last link, you get a new image, so if you don’t like the one you see, try again! If you study the linked image, you quickly see the principle behind its construction: begin with a square, then repeatedly divide it into quadrilaterals, modifying the color as you go. Stop after (say) nine iterations of this process. They key to making a satisfying image is achieving a proper balance of order and randomness. Too much of the former, and the image is boring. Too much of the latter, and it is confusing. No point to it, meh.
The Quad III image above was constructed using the same idea — subdivide quadrilaterals. Several principles (to be explained below) guided the project: (1) Use a random walk to vary the position of the points on the perimeter of the quadrilaterals used for subdivision; (2) Also use random walk to vary hue, saturations, and brightness; (3) give each quadrilateral, at each stage, a probability (say p = 0.2) of dying, or said less brutally, becoming inactive. Inactive quadrilaterals are no longer subdivided; (4) Constrain parameters like hue, saturation and brightness, which range from 0 to 1, to a smaller interval, like 0.2 to 0.4 or 0.6 to 0.95.
Let’s explain each of these in turn. One form of randomness is to choose numbers, say between -1 and 1 “totally at random,” as if you were throwing darts blindfolded at the interval from -1 to 1. You might get a series of numbers like this:
(W) 0.30, 0.91, -0.50, 0.51, -0.73, 0.84, 0.92, -0.58, -0.85, 0.12Here is another way: write down the first number of the previous sequence. Then write down the sum of the next number and the number you just wrote down. Continue this process until all the numbers are used up. Here is what you get:
(B) 0.30, 1.21, 0.71, 1.21, 0.48, 1.32, 2.24, 1.66, 0.81, 0.93Pretend that you do lots of numerical experiments like this, graphing the results each time. The graphs for method W will be very jagged and quite erratic. The graphs for method B will be less jagged and less erratic. In fact, they will look a bit like graphs of the stock market. Now use those graphs as the waveform of an electrical signal which you feed into an amplifier and then to a speaker. Method W will produce “white noise,” whereas method B will produce “brown noise.” They sound different. I find white noise to be very irritating, like static on a radio or TV, whereas brown noise is rather restful, more like the noise of a distant seashore. Enough rambling! I used versions of method B to control numerical parameters like the position of the points used to subdivide the quadrilaterals, the hue, etc. Method B gives a better balance of order versus randomness than does method W.
What about (3), the bit about quadrilaterals dying? The idea here is to have more variety in the size of the quadrilaterals — some large, the result of few subdivisions, some small, the result of many. As for (4), here is an example where the image was almost completely desaturated and the range of lightness was large:

To create a satisfying image, one has to “tune” the parameters, like the admissible hue and saturation ranges. Should they be as large as possible? Or much smaller? Should the range be over values near 0.0, or near 1.0, or near some other number? Etc. Below is an example of the app used to generate the images. Notice that it has sliders to control the ranges:

You may wonder about the Distance and Sensor labels at the bottom. The app can talk to a Raspberry Pi equipped with an ultrasonic distance sensor. It works like an artificial bat, emitting chirps above the range of our hearing, measuring the time for the echo to come back. Moving one’s hand back and forth causes the color to change and a new image to be generated.

I’ll be working on further experiments and may post from time to time if I can produce something that I really like. Here are my working notes (works best with Firefox) , and here is the code.
Notes
(1) In addition to tuning parameters, it is generally necessary to generate many images, keeping only the best. My “hit rate” is about one in twenty.
(2) Colors of Noise is a Wikipedia article that talks about different kinds of randomly generated noise and gives different colors of noise that you can listen to: white, pink, and brown. I think you will agree with me on the psychological effects of white versus brown noise.
Postscriptum

A few more remarks on this old 2013 generative art project. The above image is frame 1089 of a Processing animation. Code at github. Each square contains a number of particles whose position and color which undergo Brownian motion (algorithm B described above). The radius of the particles follows a periodic sawtooth function. The overlay color of each square varies periodically and is determined by the position of an imaginary particle traversing a periodic path on a 2 or 3-dimensional torus in RGB space. The tempo of the animation oscillates periodically with a long period on the order of tens of thousands of frames. It is this mixture of random and deterministic, periodic phenomena which leads to a satisfying result. I might try duplicating this in Elm. I suppose this is a form of “textural” art.